Forecasting with scenario tracking: Why track different scenarios for your business?


If you had the choice of either paying less for acquiring new customers, or improving the retention of existing or future customers - which would you choose? A lower CAC would mean more new customers per dollar spent. And a higher retention rate would mean customers will stay customers for longer, generating more revenue over time.
We’re trying hard to be logical, yet our brains go “why not both?”. Well, resources are limited and we need to spend time, money, and brainpower in the most efficient way. You know character creation in a video game? You might start with 20 points you get to distribute over traits like intelligence, strength, etc. With limited points at hand, you have to make tradeoffs. Can you build the strongest character in the game? Possibly, but they’ll be dumb as a rock.
If these traits were investments in different parts of your business - how do you spend the points in the best possible way? In gaming we go by gut feeling. In business, we can cheat by looking into different futures. Consider the CAC vs retention question: one future has better retention, and one future has lower CAC. Being able to take a peek at both, we can clearly see which we like better.
Think of it as a mixing table for your business metrics. You turn the different knobs that correspond to changes in your business and instead of hearing an Avicii banger, you see how things can play out.

Sales, or money in the bank?
In a simplified world, let’s say a customer costs $50 to acquire, and within 24 months you are quite sure they will have spent $200. This is lovely. “I’d like to buy 10 000 of those users”.
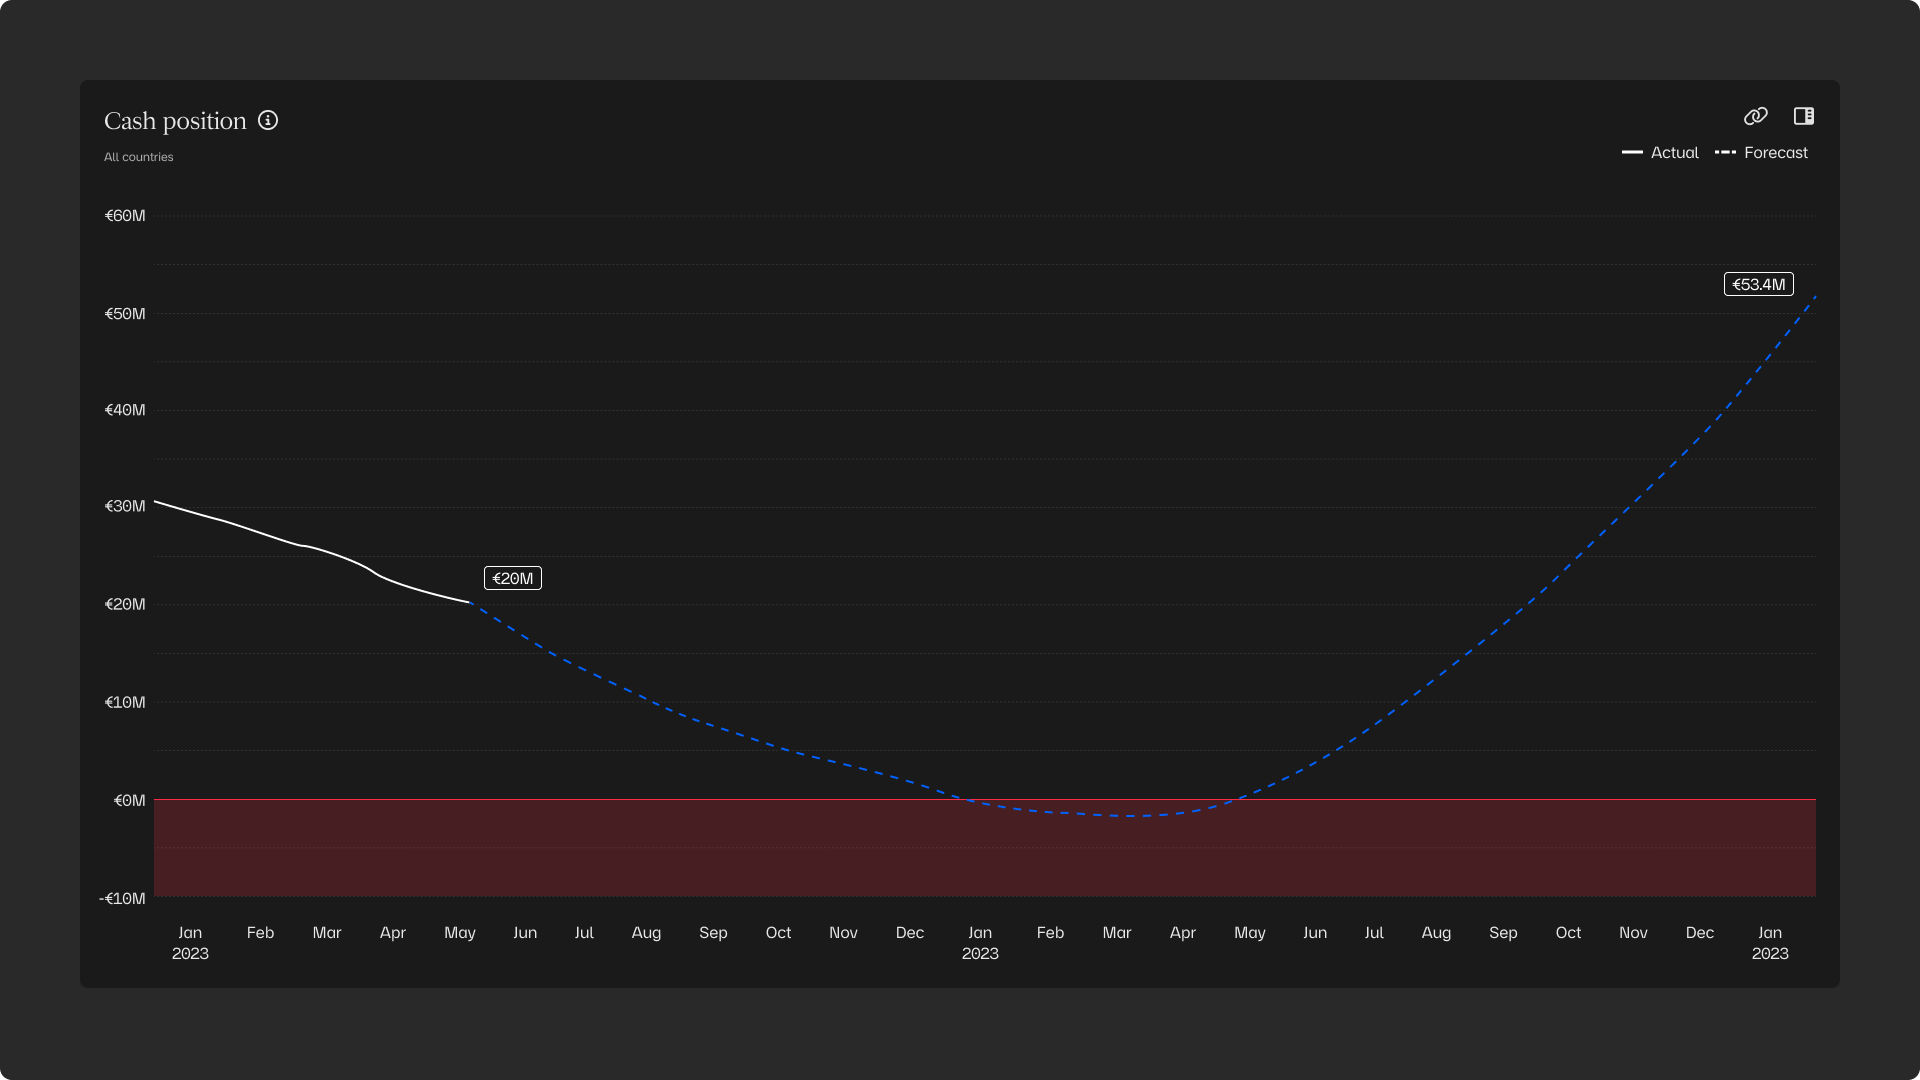
It’s tempting to crank up the marketing knob to the max and watch the sales forecast skyrocket. Ring ring, it’s the bank - the numbers on the account are red. We learn that we should operate to optimise sales, but with the constraint of the money in the bank, the cash position, never going below zero.
To do this, we need to forecast revenue and costs individually to enable us to produce a cash position forecast. This is the hard part. The cash position forecast itself is very, very simple but the real game changer. If you spend more than you make, it goes down, and if you make more than you spend, it goes up.
This simple idea will show you how long your runway is. And how much you can prolong it by turning a few knobs. What you’re looking for is that J-shaped curve, where you burn money at first, but reap the rewards over time.
Forecasting in AIM
Building a mixing table for your future business metrics requires dividing the problem into smaller pieces. The name of the game is not just trying to achieve a revenue forecast, it’s all about the steps you take to get there.
AIM takes care of individual business metric forecasts, including costs, new customers, retention rates, customer spending, and purchase frequency. To generate a comprehensive revenue forecast, AIM combines all relevant revenue metrics, and similarly, it bundles all cost-related metrics to create a complete cost forecast.
Before the bundling, we can modify a metric, let’s say retention, with simple mathematics. This is how you can tweak one metric at a time in isolation, gaining a clear understanding of how it impacts your cash position and sales. By forecasting each cohort individually, the forecast is made up of tens of thousands of pieces, giving us the controls to finetune the tweaks with high precision. AIM equips you with the tools to discern which actions move the needle in the right direction and which have the most significant impact.

There’s so much to explore on this topic. If we know the constraints (don’t run out of money), the goal (maximise revenue), and the knobs (CAC, retention, marketing spend, etc.), can we flip this equation and automatically turn the knobs to their ideal positions? And going even further by adding more knobs, we eventually have a cockpit style business simulator.
With my data science angle, I’m often tempted to see growing a business as an optimization problem like any other. We define what to optimise for, figure out which actions contribute more to the objective, and put the plan in motion. While trying really hard to not oversimplify things and trick myself into believing the real world works like this, I also find joy in the fact that data really shows the way. We build forecasting for hundreds of companies every day, so this is where the AIM users come into play. Knowing the business and knowing the data really is the best thing one can do.


About Gilion
Gilion changes the growth experience for founders – through providing access to groundbreaking scaleup loans the frontier of growth forecasting. Gilion is now live in Sweden, Denmark, Finland and Germany. Gilion was founded in 2021 by serial entrepreneur Oliver Hildebrandt, veteran banker Axel Bruzelius, Spotify's former VP of Analytics and former EQT Ventures founding Partner Henrik Landgren.
For questions:
Fredrik Westin, Head of Communications
fredrik.westin@gilion.com
+46 73 543 51 08